
Recovered from the Wayback Machine.
The history of the citizen initiative, also called a “ballot initiative” or “popular initiative”, has its beginning in the late 1800s through early 1900s, during the Populist and Progressive Era. The purpose for the initiative was to give the people the ability to break the monopoly that money interests frequently had on state legislatures. These initiatives have long been considered the act of last recourse for citizens, invoked when state legislatures refused to act on popular or needed legislation.
Proposition B came about because Missouri state representatives would not act for necessary improvements to the Animal Care Facilities Act (ACFA), the set of regulations which regulate commercial dog breeding and other pet-specific industries in Missouri. There was a bitter fight to get the initiative on the ballot, as Missouri state representatives presented bill after bill to alter the state Constitution to deny the citizen initiative process for anything to do with animals, or to modify who can collect signatures1,2.
Even the wording of Proposition B was challenged in court, a challenge that failed3.
Not long after Proposition B was voted into law in Missouri, opponents of the ballot initiative were pointing out the “unfairness” of the vote because, according to them, only “103 out of 114 counties voted for it!” Or you heard people talking about the “urban/rural” split. Senator Bill Stouffer, a strong opponent to Proposition B, stated at a recent meeting, “Somehow you have to break this divide between urban and rural because when you have 80% against in rural and 80% for in urban somehow there has to be some understanding of each other.”4
However, according to the State of Missouri Constitution, you can have a 100% rural vote against something and 100% urban vote for it, or 100% rural vote for and 100% urban against, and it still becomes law if the majority of the people of the state vote for the bill; what matters in Missouri is the people—not the demographics of the vote. In addition, the number of counties that voted for or against Proposition B also doesn’t count, because a county that has a few thousand people doesn’t weigh equally with a county that has several hundred thousand people. It is the count of people, not the location of the voters, that counts.
Now, what does have meaning in Missouri is the type of item on the ballot, and whether it is a Constitutional amendment or new or modified state statute. Proposition B is new state statute, which can then be amended by the legislature. The legislature is made up of representatives based on district, rather than county, and districts are, themselves, derived from population density. So, rather than look at counties, we need to look at a break down of the Proposition B vote by House of Representative district and Senate district.
Unfortunately, Missouri does not track votes for a statewide initiative by district. Understandable, because you don’t, typically, want the legislature attempting to override citizen initiatives. Citizen initiatives are difficult to get on the ballot: requiring close to a 100,000 signatures to be placed on the ballot in Missouri, and costing a considerable amount of time and money—both to the initiative proponents, and to the state of Missouri. In 2010, 100 petitions were filed with the State of Missouri. Of these, only 23 were approved by the Secretary of State, and only four could gather enough signatures. Ultimately, by the time November 2 came around, only two citizen initiatives were on the ballot, including Proposition B5 As you can see, citizen initiatives are not a light undertaking.
Since we cannot get a definitive breakdown of Proposition B votes by Missouri legislative district, I created several spreadsheets in order to analyze the vote data6 and manually split it by district. Most of the district split was cleanly for Proposition B or against it, as the district was contained entirely within a county, or overlapped several counties with little or no mixed vote. However, several Senate and Representative districts were split across counties, and the counties varied in Proposition B support. In addition, there were larger towns that, though they were in counties that ultimately voted No on Proposition B, did impact on the overall county percentages, raising the Yes vote high enough to consider that any urban districts were, effectively, for Proposition B.
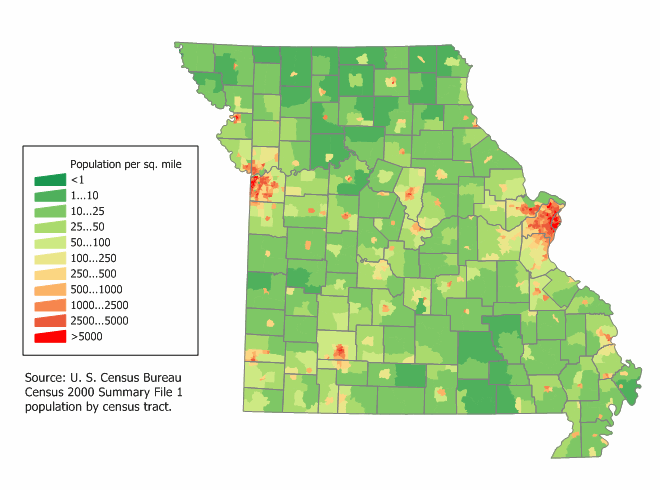
To help in my effort, I downloaded a population density map for Missouri, based on the 2000 Census. Though we have had population loss since 2000, the map densities should be relatively accurate.
I also found and downloaded a Missouri map7 with counties marked in color gradients based on the Proposition B percentages.
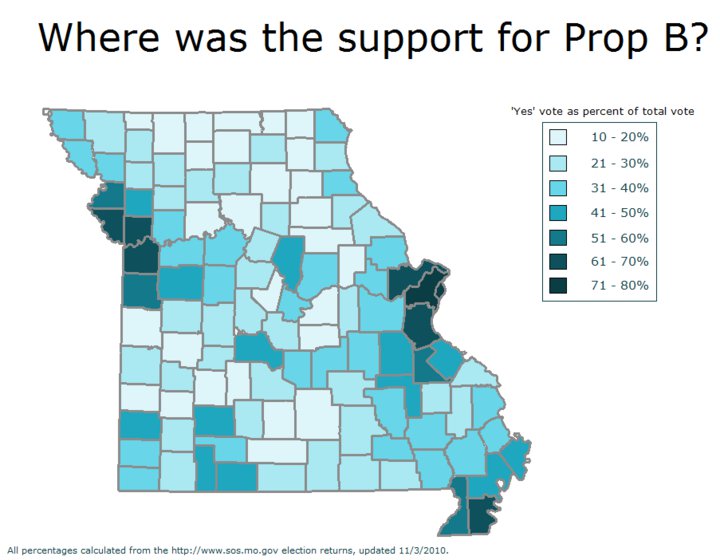
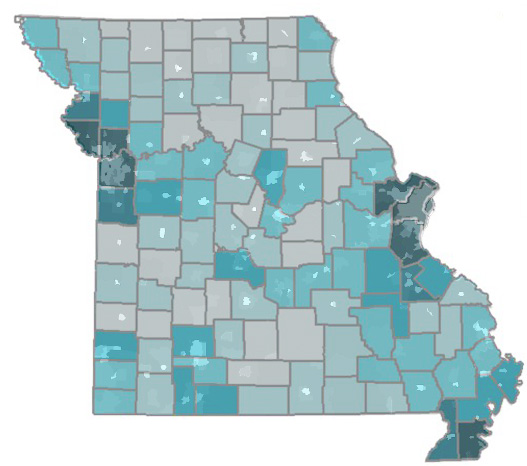
I merged the two maps. The resulting map strongly indicates an urban influence that goes beyond just the St. Louis and Kansas City areas. There are indications of an urban influence surrounding Columbia, as well as Springfield and even Branson. More importantly, there’s also stronger support for Proposition B along major highways, as well as popular tourism locations—both of which account for the positive outcomes in counties in the Missouri boot heel region.
I then created spreadsheets to help gather the data for my analysis. One spreadsheet contains a listing of counties with the percentage of voters8, as well as the for and against Proposition B vote, which I then used to calculate the county’s overall Proposition B vote percentage. For each county, I also listed the Senate and House of Representative districts that cover all or part of the county. I converted this spreadsheet to a Results web page, which also contains a link to a CSV file with the data.
I created a second spreadsheet for the Senate districts, listing out the District number and the current District representative. Most of the districts either encompass several counties, or are included solely within one county, and it was a simple matter to determine the Proposition B vote. Other districts, though, had overlapping counties with conflicting votes. I then looked at the population density of the district, in addition to evaluating the vote in surrounding areas, and either set the district to Yes or No based on the findings.
District 30 is primarily in the Springfield area, which is largely urban. The overall county vote was No, but the percentage for Proposition B was much higher than in surrounding counties. I attribute this to the urban effect, and significant enough to give District 30 to the Yes side.
I converted the spreadsheet to a Senate Proposition B vote web page, which also links the CSV file for the data.
I created a third spreadsheet for the Missouri House of Republican districts. These were, in many ways, simpler to work with then the Senate results, because the districts were smaller and it was simpler to determine the Yes or No vote for the district. However, again, there were districts with overlapping district votes, or districts solely contained in urban areas and enough evidence of urban influence to give the district to the Yes side.
As with the Senate results, I converted the data to a House of Representative Proposition B vote web page, with links to the CSV file with the raw data.
Both pages should demonstrate that most of the districts did not require analysis, and it’s a simple matter of looking at the district county or counties to determine how the district voted. Of the districts where I had to derive the vote, the Yes and No split was about even. I have a high degree of confidence that the representatives from all the districts will, most likely, agree with the results.
According to the data and maps, I found the following for the Missouri Senate Districts:
19 Senate districts voted Yes for Proposition B
15 Senate districts voted No for Proposition B
I found the following for the House of Representative Districts:
91 House of Representative districts voted Yes for Proposition B
72 House of Representative districts voted No for Proposition B
I had to manually pull together most of the data. If you see an error in my calculations, please email me a note, or add a comment and I’ll make a correction.
The Proposition B proponents gathered more than 190,000 signatures to put Proposition B on the ballot.
-
,
-
- ,
2 replies on “Proposition B and Missouri state districts”
Can you be more specific about the content of your article? After reading it, I still have some doubts. Hope you can help me.
I don’t think the title of your article matches the content lol. Just kidding, mainly because I had some doubts after reading the article. https://accounts.binance.com/en-ZA/register-person?ref=B4EPR6J0